Spoken-word audio statistics 2022: Listener habits & demographics
Discover the latest spoken-word audio statistics in our roundup. This data will help you get to grips with listener habits and demographics, so you can build an effective audio content strategy for 2022.
74% of listeners consume audio during their daily rituals
40% of listeners plan their day and activities around audio content⁴⁰
Digital audio listening experiences have a stronger impact on the brain than radio listening experiences: +25% emotional intensity, +28% detail memory, +25% global memory, and +23% engagement
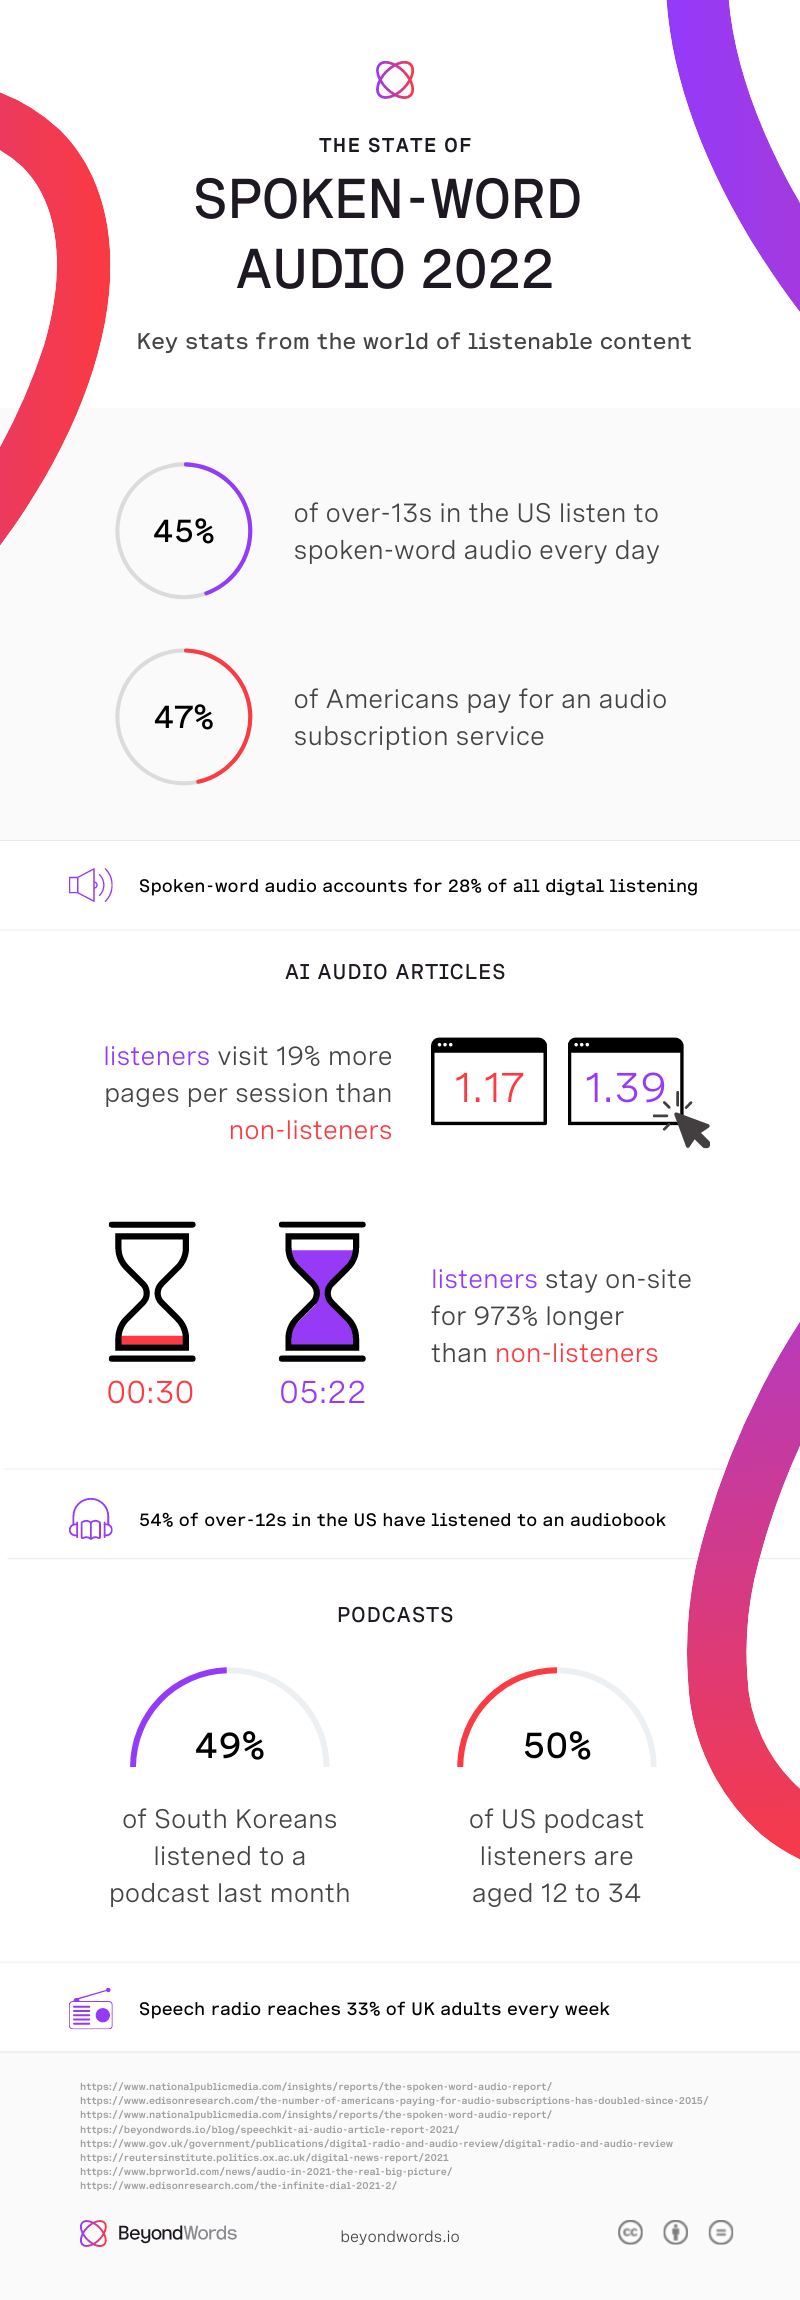
47% of Americans pay for an audio subscription
The average US adult listens to digital audio for 1 hour 34 minutes a day
Spoken-word audio accounts for 28% of digital listening
73% of over-12s in the US (approximately 209 million people) listened to online audio in the past month (2022):
- 87% of 12 to 34-year-olds
- 81% of 35 to 54-year-olds
- 52% of 55 and overs
67% of over-12s (approximately 192 million people) in the US listened to online audio in the last week
71% of over-12s in Australia listened to online audio in the last week, listening for an average 13 hours and 31 minutes
Listened to online audio in the past month (2021):
- UK (16+), 75%
- Australia (15+), 73%
- Canada (18+), 71%
- South Africa (15+), 61%
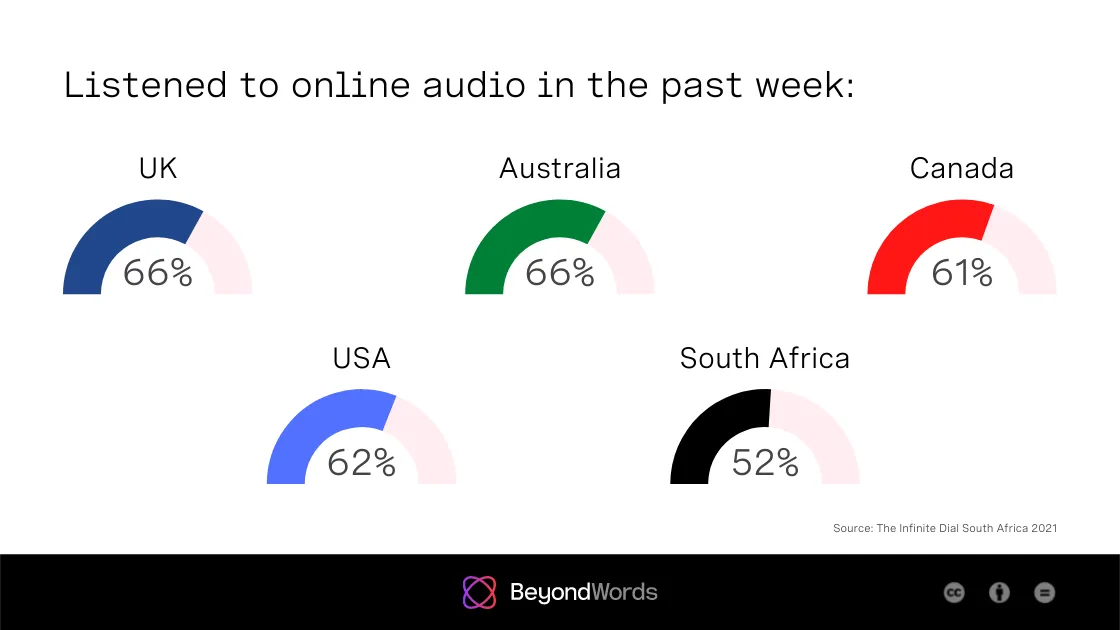
Listened to online audio in the past week (2021):
- UK (16+), 66%
- Australia (15+), 66%
- Canada (18+), 61%
- South Africa (15+), 52%—listening for an average of 6 hours and 20 minutes
Audio hardware statistics
The number of smartphone subscriptions worldwide increased by 71% from 2017 to 2021, to 6.3 billion
Global annual headphone sales increased by 51% from 2016 to 2021, to 1.3 billion
35% of over-12s in the US own a smart speaker (2022)
Who listens to spoken-word audio?
75% of the 18+ US population listens to spoken-word audio each month
The average over-13 in the US listens to 1 hour and 4 minutes of spoken-word audio every day
46% of the 13+ US population listen to spoken-word audio daily:
- They listen to an average of 2 hours 19 minutes every day
- They spend more time with spoken-word audio than with music (51% vs 49%)
Share of US digital listening time spent listening to spoken-word audio (as opposed to music)
In 2022:
- Total: 29%
- On a mobile device: 34%
- By age: 13 to 34 (26%), 35 to 54 (30%), 55 and over (32%)
In 2021:
- By gender: Men (32%), women (24%)
- By ethnic group: White/other (29%), African-American (22%), Hispanic/Latino (27%)
51% of US spoken-word audio listeners reported listening more in 2021 than they did five years previously
Why do people listen to spoken-word audio?
Monthly listeners cite the following reasons for listening to spoken-word audio:
- the ability to multitask (71%—the most popular reason)
- it allows them to process information more efficiently (60%)
- they like listening more than reading (56%)
- they need to stay informed (52%)
Among this audience:
- 58% say spoken-word audio is a productive use of their time
- 54% say spoken-word audio engages their mind in a more positive way than other media
- 45% say spoken-word audio is becoming a more important part of their life
How and where do people listen to spoken-word audio?
48% in the US listen via AM/FM radio, 22% via podcasts, 10% via audiobooks, 20% via other platforms
47% in the US listen on an AM/FM radio receiver, 31% on a mobile device, 9% on a computer, 4% on a smart speaker, 9% on another device
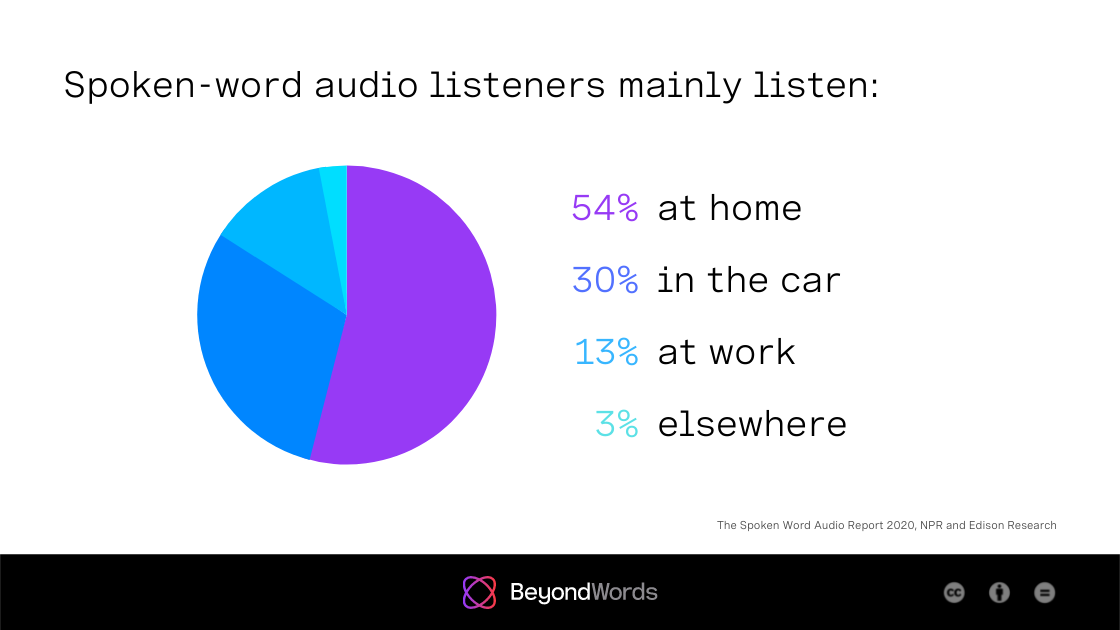
54% in the US listen at home, 30% in the car, 13% at work, and 3% elsewhere
Searching the internet is the most common way for US listeners to discover new spoken-audio content, with 59% having done so
49% of US spoken-word audio listeners listen exclusively alone, while 51% sometimes listen with others
News audio publishing statistics
80% of news leaders will put more resource into podcasts and digital audio in 2022
The most popular spoken-word audio topic in the US is news/information, with 56% of listeners having consumed this type of content
40% of spoken-word audio time in the US is spent listening to news or information
News podcasts make up 7% of all those produced but account for 30% of top podcast episodes in the US
Daily news podcasts make up 1% of all those produced but account for 10% of top podcast episodes in the US
43% of daily news podcasts take the format of a deep dive, 24% a news roundup, 20% a micro bulletin, 14% an extended chat (US, UK, Australia, Sweden, France, and Denmark)
The Daily, a podcast published by The New York Times, averages four million downloads a day
The Intelligence, a podcast published by The Economist, reaches around 2.5 million listeners per week.
29% of podcast listeners in the US would like to see more news/current events/politics podcasts
Listened to a news podcast last week:
- Age 18 to 24: 13%
- Age 25+: 31%
News is the top genre for US podcast advertisers, accounting for 19% of revenue
There were 51,406 news podcasts launched worldwide in 2020
Podcast statistics
40% of millennials and Gen Zs rank their trust in podcasts higher than their average trust in traditional media sources
25% of podcast listeners in the US and 14% in the UK said they are very or somewhat likely to pay money for a podcast in 2022
As of June 2022, there are over 67.4 million episodes on Apple Podcasts
Proportion who subscribe to audiobook or podcast services in the UK:
- 18–24s (21%)
- 25–34s (18%)
- 35–44s (13%)
- 45–54s (12%)
- 55 and overs (5%)
Podcast awareness (2021):
- Australia (15+), 92%
- Canada (18+), 78%
- USA (15+), 78%
- UK (16+), 71%
- South Africa (15+), 48%
How many people listen to podcasts?
34% listened to a podcast in the last month (2022): South Korea (52%), Ireland (46%), Sweden (44%), Norway (42%), Spain (41%), Chile (41%), USA (37%), Canada (36%), Switzerland (35%), Argentina (34%), Australia (33%), Singapore (33%), Denmark (32%), Austria (31%), Netherlands (30%), Finland (30%), France (29%), Italy (29%), Belgium (29%), Germany (29%), Japan (27%), UK (25%)
Listened to a podcast last week (2021):
- USA (15+), 29%
- Australia (15+), 26%
- UK (16+), 25%
- Canada (18+), 23%
- South Africa (15+), 20%—listening to four episodes on average
29% of people across eight international markets listened to podcasts in the past week
95 million monthly active users in India (20% of the online population aged 12+) has listened to a podcast
280 million monthly active users in China (62% of the online population aged 12+) has listened to a podcast
53% of US podcast listeners listen weekly
62% of over-12s in the US have listened to a podcast²⁹
Who listens to podcasts?
- By gender: 53% men, 46% women, 1% other
- By age: 47% aged 12 to 34, 33% aged 35 to 54, 20% aged 55 and over
- By ethnic group: 59% white, 16% African-American, 16% Hispanic, 3% Asian, 6% other
US monthly podcast listeners by generation: Gen Z (37%), Millennials (45%), Gen X (23%), Boomers (25%)
UK weekly podcast listeners by generation: Gen Z (32%), Millennials (38%), Gen X (16%), Boomers (9%)
South African monthly podcast listeners:
- By age: 51% aged 15 to 34, 38% aged 35 to 54, 11% aged 55 and over
How and where do people listen to podcasts?
In the US, podcast listeners listen mainly through YouTube (26%), Apple Podcasts (22%), Spotify (17%), Google Podcasts (14%), Pandora (10%), NPR app or website (9%)
In the UK, podcast listeners listen mainly through Spotify (30%), BBC Sounds (27%), Apple Podcasts (20%), YouTube (14%), Audible (8%), Google Podcasts (8%), or a news website/app (5%)
In Germany, podcast listeners listen mainly through Spotify (25%), YouTube (19%), ARD Audiothek (12%), Apple Podcasts (11%), Audible (9%), Google Podcasts (8%), or a news website/app (8%)
In Spain, podcast listeners listen mainly through YouTube (30%), Spotify (26%), iVoox (19%), Google Podcasts (13%), a news website/app (12%), Audible (7%), or Apple Podcasts (7%)
In Australia, podcast listeners listen mainly through YouTube (26%), Spotify (25%), Apple Podcasts (23%), ABC app or website (22%), Google Podcasts (14%) Podcast Addict (8%)
Main ways in which people discover new podcasts (USA/Europe):
- Recommendations from friends/family/work colleagues (37%/32%)
- Searching the internet (27%/39%)
- Recommendations or advertisements via social media (25%/27%)
- Recommendations via my usual podcast app (24%/20%)
- Recommendations or advertisements on other podcasts (21%/17%)
- Promotions for podcasts via radio or TV (17%/15%)
- Recommendations in newspapers/magazines (12%/14%)
Among US adults who have driven or ridden in a car in the last month, 30% have listened to podcasts in the car
Among weekly podcast listeners in the US (Q4 2021):
- 20% most often listen in the car, 59% at home
- 13% most often listen on their desktop/laptop computer, 73% on a smartphone
Where monthly podcast listeners in South Africa (Major Metro Commercial Population, 15+) typically listen:
- 76% at home
- 13% at work
- 4% in a vehicle
- 7% other
Where monthly podcast listeners in Australia (12+) have listened:
- 83% at home
- 60% in a car/truck
- 50% while walking around/on foot
- 29% while riding public transportation
- 27% at work
- 19% at a gym/while working out
Podcast advertising statistics
US podcast advertising revenues exceeded $1.4 billion in 2021 and are expected to exceed $4 billion by 2024
- Revenue has grown faster than the total internet ad revenue market (72% vs 35% year-on-year)
- Most ads (55%) are 16 to 30 seconds long
- Pre-roll, mid-roll, and post-roll ads account for 32%, 64%, and 4% of revenue respectively
In 2021, online audio generated $3.5–$4 billion of revenue in China
Audio article statistics
69% of millennials and 61% of Gen Zs think audio formats are one of the greatest ways to tell stories
62% of millennials and 52% of Gen Zs think audio amplifies more diverse perspectives than traditional media
Zetland’s paying members consume 80% of articles via audio
66% of people surveyed said there's too much visual stimulation in today's media landscape, and that audio provides a nice escape from it
BeyondWords AI audio article statistics
All data is from our AI Audio Article Report 2021:
Non-listeners spend an average of 30 seconds on-site, whereas listeners stay for 322 seconds (+973%)
Non-listeners visit 1.17 pages on average, whereas listeners visit 1.39 (+19%)
Listeners are 32% more likely to engage in multiple sessions than non-listeners
Returning visitors are 38% more likely to press play than new visitors
The average new user who doesn’t engage with audio spends 2 seconds on-site, while the average new listener stays for 225 seconds (+11,150%)
18 to 34s are 1.5x more likely to press play than 25 and overs
35 to 54s who press play stay on-site for 9x longer than those who don’t
55 and overs who press play visit 1.5x more pages than those who don’t
Audiobook statistics
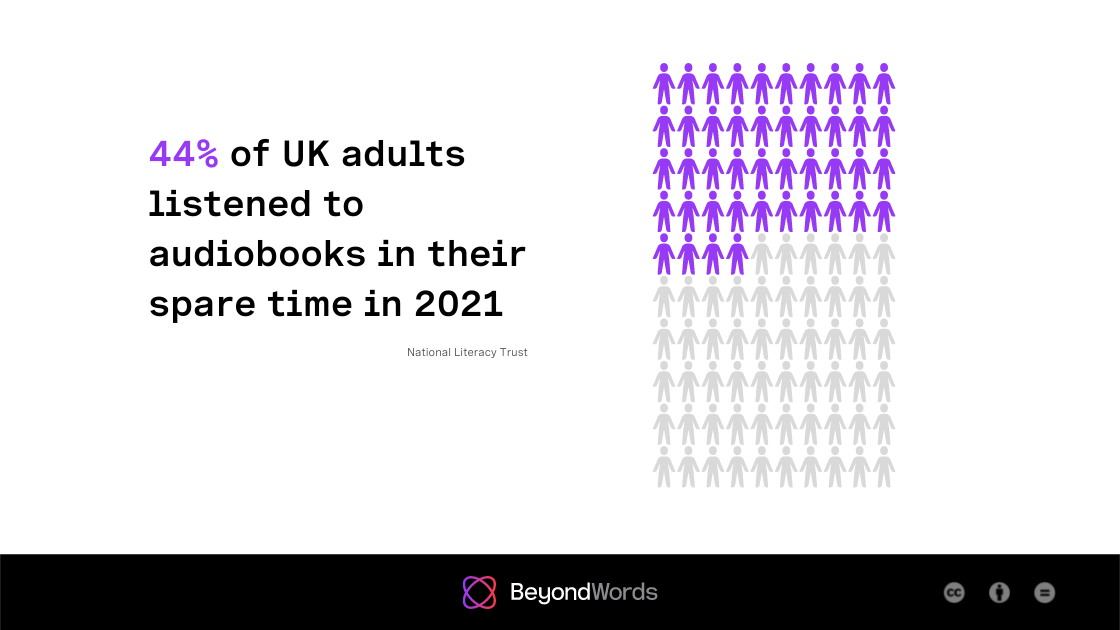
44% of UK adults said they listened to audiobooks in their spare time in 2021, with 27% listening at least once per week
- 72% said listening keeps their brain stimulated
- 70% said listening makes them feel less stressed and anxious
- 67% said listening cheers them up when they're feeling down
8% of adult British readers typically consume books into audiobook format
- 6% (16 to 24), 13% (25 to 39), 7% (30 to 55), 6% (55 and over)
- 9% male, 7% female
In the UK, there were 24 million audiobook purchases in the 12 months to June 2021, accounting for a 6% share of the book market
54% of the US population (aged 12+) has listened to an audiobook, and 56% of listeners are under the age of 45
US publishers' audiobook revenue grew 12% in 2020 to $1.3 billion
55% of US listeners say they listen most of home, while 30% typically listen in the car
38% of US audiobook listeners are subscribed to at least one audiobook service
Business professionals cite listening to storytelling (26%) and accessibility/time-saving (26%) as the top benefits of audiobooks
Most business professionals listen to audiobooks while driving (31%), doing housework/DIY (25%), exercising (18%) or walking (10%)
Radio statistics
89% of the UK population listens into radio every week, with listeners tuning in for an average of 20.2 hours
Speech radio stations reach 33% of UK adults every week
80% of the adult population in Ireland tunes into radio every day, listening for a total of 13.1 million hours
88% of adults in the US listen to radio every week, with listeners tuning in for an average of 12.2 hours
77% of people across eight international markets listened to radio in the past week
69% of South Africans (Major Metro Commercial Population, 15+), listened to radio in the last week²⁸
Have we missed anything? Email [email protected] to let us know.
Infographic